
I'm a text-oriented person, but sometimes a picture really is worth a thousand words. Problem is, diagramming software is often slow and clumsy. And it's more precise to generate diagrams from a textual description anyway. Talk about coming full circle.
Besides, when a diagram is generated from code, it can be placed in source control alongside whatever it describes.
Graphviz is an old, established tool for automatically drawing diagrams with fairly complex layout from a textual description. In other words to make this:
out of this:
digraph {
	A -> B -> C
	D -> B -> E
}
It supports half a dozen layout engines, three dozen output formats and numerous formatting options, including various shapes and colors:

With code like:
graph {
	layout=fdp
	node [ style="bold,filled" shape=egg color=blue fillcolor=pink ]

	Work [ shape=circle color=brown fillcolor=yellow ]

	Play -- Craft
	Craft -- Art
	Art -- Play
}
I used it successfully to make mind maps and UML class diagrams, but it supports much more. An advanced introduction from 2020 covers some less-known features.
While Graphviz is a command-line suite, there are tools like Graphviz Visual Editor, Graphviz Online (which also works on older mobile devices) or Edotor.
A much newer tool, Pikchr is the latest take on a mature concept. Also much simpler, it's optimized for diagrams like this one:

Which can be obtained from the description below:
fill=white
arrow "source" "code"
box "preprocessor"
arrow "program" "text"
box "compiler"
arrow "assembly" "language"
box "assembler"
arrow "object" "code"
box "linker"
arrow "executable" "program"
Pikchr doesn't do auto-layout, but has some tricks up its sleeve anyway. For a more complex layout, you can first place the boxes, then draw the arrows:

Which can be written in a surprisingly natural style:
color=brown;fill=lightgray

A: box "A"; move; B1: ellipse "B'" thick
down; move; A1: box "A'"
left; move; B: ellipse "B" thick
arrow from A.se to A1.nw
arrow from B.ne to B1.sw thick
Pikchr can only output SVG, but is very small, fast and portable. Otherwise it also supports fonts, colors and the like, along with a rich language for manual layout.
A more specialized language (but otherwise surprisingly similar) is Zinnia, by David Welbourn. It works on a spreadsheet-like principle and is intended for game maps, but can of course be (ab)used for other purposes. Version 3 only renders to an HTML5 canvas via JS, but the result is trivially exported to PNG:
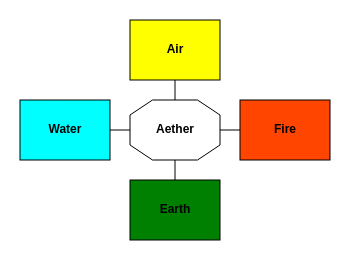
Which is generated from this code:
set id to elements.
C3: octagonal room "Aether".
B3: path from south to north.
A3: yellow room "Air".
D3: path from north to south.
E3: green room "Earth".
C2: path from east to west.
C1: cyan room "Water".
C4: path from west to east.
C5: orangered room "Fire".
You can see a bigger sample on the City of Dead Leaves homepage.
Mermaid and D2 each have their own. See the official websites.
Graphviz also has a couple, mentioned on the about page:
Kroki provides a unified API for most of the above and many others; there's a simple editor on the homepage.